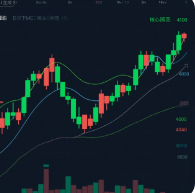
In-depth Analysis of Hourly Trend: Coexistence of Low-level Repair and Potential Risks
Introduction
In financial market technical analysis, the hourly chart plays a pivotal bridging role. Unlike daily-level macro trend judgments or minute-level short-term fluctuations, it provides a medium-to-short-term trading decision window. Currently, the hourly level shows a typical low-level consolidation repair pattern. After slight oversold conditions, a weak golden cross emerges, but the overall bearish alignment of moving averages remains, limiting rebound space, with minor-cycle top divergence risk lurking. This article systematically interprets current hourly trend characteristics from technical analysis essence and market logic, exploring trading strategies and risk control points during bottom-building volatility.

I. Trading Essence and Practical Significance of the Hourly Level
The hourly level holds a unique position in technical analysis. Compared to the daily level, it catches short-term price anomalies more sensitively, providing earlier entry signals; compared to minute levels, it filters out random noise while retaining effective trend information. This time frame essentially balances trading frequency and signal-to-noise ratio.
In practice, the hourly level suits professional investors seeking medium-to-short-term opportunities. It reflects near-term capital flows and offers precise entry points for trend traders. During range-bound markets, hourly technical indicators often issue turning signals first, giving traders an edge.
Currently, the hourly low-level consolidation repair reflects a tug-of-war between bulls and bears. After earlier declines, bulls organize local counterattacks to recover lost ground; bearish power has weakened but not vanished, still dominating the medium-term trend. This battle provides rich information but demands higher analytical skill.
II. Secrets of Low-level Repair: Oversold Indicators and Golden Cross Signal
On technical indicators, the hourly level shows two key features: slight short-term oversold and a weak golden cross repair signal. While seemingly positive, these need careful interpretation given market context.
Oversold typically means prices have fallen too far too fast, triggering technical rebound demand. This is often accompanied by shrinking volume, indicating selling pressure waning. However, the key is whether oversold areas form effective support. In strong markets, oversold may be fleeting; in weak markets, oversold zones may only be halftime rest stops during a downtrend.
A golden cross, when a short-term moving average crosses above a long-term one, is a relatively reliable buy reference, usually signaling a short-term improvement and potential long opportunity. But emphasis on "weak" is important. A weak golden cross means limited signal strength, possibly just a technical correction rather than a true trend reversal. In practice, such signals require subsequent confirmation and should not be the sole entry basis.
Historically, oversold and golden cross at the hourly level in a complete downtrend often represent "fatigue rebounds" or "technical repairs." Such rebounds typically show three characteristics: limited upside often failing to break key resistance, short duration possibly just a few trading hours, and a high probability of returning to the original trend after the rebound.
III. Moving Average System: Rebound Ceiling Under Bearish Alignment
As a core technical tool, the moving average system shows a typical bearish alignment on the current hourly chart. Bearish alignment means short-term MAs are below long-term MAs, with the system diverging downward, usually marking a downtrend.
The suppression effect of bearish alignment on rebounds manifests in several ways:
First, the MA system creates "layered resistance" for bull rebounds. When prices try to rise, they first encounter the 5-hour MA, then the 10-hour MA, and so on. Each MA can be a hurdle that exhausts rebound momentum.
Second, under bearish alignment, market sentiment is generally bearish. Investors doubt rebound sustainability; once prices touch key MAs, trapped longs and stop-loss orders flood in, creating new selling pressure.
Third, bearish alignment often aligns with death crosses or weak conditions on indicators like MACD and RSI, forming multi-cycle, multi-indicator bearish resonance, strengthening bearish power.
Given this technical backdrop, even post-oversold repair rallies have limited upside. Investors should treat all rebounds cautiously, refraining from blind chasing until the MA system re-forms a bullish alignment.
IV. Minor-cycle Top Divergence Risk: A Deadly Trap Behind Rebounds
The most critical risk in the current hourly repair structure is minor-cycle top divergence. Divergence occurs when price and indicator trends disagree, often a warning of an impending trend change.
Specifically, minor-cycle top divergence means that while prices make short-term new highs or approach previous highs, technical indicators fail to follow, instead showing lower peaks or a top death cross. This suggests upward momentum has exhausted and a reversal is imminent.
At the hourly level, top divergence signals deserve special attention because they may trigger daily-level declines. Each hourly top divergence could be the start of a larger drop. In an already weak market, any divergence risk is amplified and may cause chain reactions leading to fast selloffs.
Practically, investors should combine divergence signals with moving average suppression. When minor-cycle top divergence appears under a bearish alignment, its validity increases significantly, meaning any technical rebound could end at any time and the market re-enter a downtrend.
V. Bottom-building Volatility: The Inevitable Process of Trading Time for Space
Combining all factors, the current hourly trend can be largely defined as a "bottom-building consolidation" phase. The core feature is using time to exchange for space, gradually absorbing earlier downward pressure, repairing oversold technical indicators, and waiting for new market catalysts.
The bottom-building process typically goes through three stages: first, stabilization after sharp drops, with narrowing price range and shrinking volume; second, a consolidation repair stage with bulls and bears repeatedly battling around a price zone; finally, a directional selection stage where the market breaks a key level after sufficient accumulation, starting a new trend.
During bottom-building, investor trading difficulty increases significantly. Frequent narrow-range fluctuations can mislead signals; chasing highs and cutting lows can lead to double losses. Therefore, the core strategy in this phase should be "mostly observe, act on opportunity," seeking low-risk trades near key support while strictly controlling position and stop-loss.
From the current environment, the hourly bottom-building may take more time. Repairing the MA system, improving market sentiment, and reshaping technical indicators all require time as a cost. Investors need patience, avoiding rash moves before the trend clarifies.
VI. Practical Strategy Suggestions: How to Survive Bottom-building Volatility
Given current hourly characteristics, investors need targeted strategies to preserve capital and accumulate profits in bottom-building conditions.
First, position control is key. Before the trend becomes clear, position management is far more important than single trade profit or loss. Keep total position light, leaving room to maneuver.
Second, reduce trading frequency. Narrow fluctuations in bottom-building are unfriendly to short-term traders. Frequent trading increases costs and error probability. The right approach is to wait patiently for higher-probability opportunities.
Third, set strict stop-losses. For existing positions, strictly follow stop-loss discipline to prevent sudden market weakness from causing large losses. Stop-loss levels should reference key support and the MA system, combined with money management principles.
Fourth, watch key level breakouts. In bottom-building, real trading opportunities often emerge when prices break key resistance or support. Monitor previous highs/lows, key MA levels, and trendlines. Once an effective breakout occurs, act decisively to follow the trend.
VII. Conclusion
The hourly low-level consolidation repair is an external manifestation of market internal rules. Short-term oversold and golden cross repair signals provide technical basis for longs; but bearish MA alignment and minor-cycle top divergence risk limit upside. In this complex tug-of-war, investors should stay objective and calm, neither blindly bearish nor easily bullish, but flexibly adjust strategies based on technical signal changes.
Though bottom-building is lengthy and painful, it is a necessary phase for the market to return to health. Every significant move requires such accumulation and consolidation. For traders who truly understand market dynamics, current volatility is precisely a phase of building future gains. Stay patient, respect trends, wait for clear entry signals — that is the most rational choice in this environment.
Before the market completes bottoming and starts a new trend, our only task is to manage risk and wait patiently for our opportunity. In financial markets, true wisdom is not predicting but adapting to the market. Time will prove that investors who stick to principles during bottom-building will ultimately reap generous rewards from the market.